Driver's Small vs. Large Signal Response

The near field woofer response is modeled as a lumped parameter derived from the Thiel / Small model. Generally this is a good approximation for small signal response. For large signal this model is inadequate since it does not deal with the cone compliance and Bl force factors which are changed by the displacement of the voice-coil and produce as the most dominant non-linearity, substantial distortion components as well as affect the vibration and transfer characteristics of the exited fundamentals. These effects are discussed and modeled in the paper "The Nonlinear Large Signal Transfer Characteristics of the Electrodynamical Loudspeaker at Low Frequencies", by Wolfgand Klippel, AES preprint 3049 (H-7).


To compute the non-linearity effects for a specific driver is nontrivial, since specific values have to be measured and extracted from T/S data. Nevertheless some general examples of the changes for a large signal vs. small signal can be given. For a TL design the critical impact is the phase linearity at Fr vs. stuffing density change.

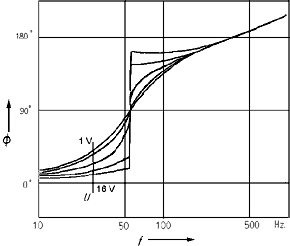
Fig. 1 Phase Response vs. b2 non-linearity.

click image for larger chart


Phase Response Non-Linearity

Fig.1 shows that for the nominal driver as drive voltage increases the phase response which is acceptably linear @ 1v, degenerates to a step like response @ a 6 volt signal. This phase response would have a profound effect on the TL's Terminus optimization at Fr.
 

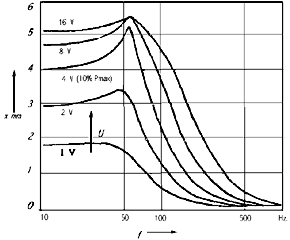
Fig. 2 Voice-Coil Excursion for b2 non-linearity

click image for larger chart


Amplitude Response Non-Linearity

Fig. 2 shows that as the drive voltage is increased resulting in a increase in the x-max excursion, a strong peak at about Fs results. This again would be reflected in the magnitude vs. frequency linearity. These two examples for b2 non-linearity only show the inadequacy of the small signal model when considering the response of a driver.

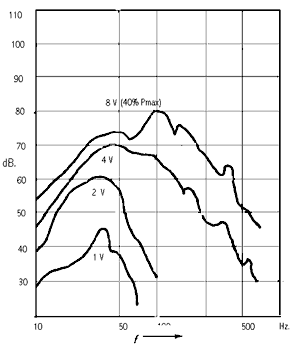
Fig. 3 2nd Harmonic Distortion Effects

click image for larger chart


Second Harmonic Distortion

Fig. 3 shows the spectral and magnitude increase in the 2nd harmonic distortion as the drive level increases and the coil moves out of the linear region of the Bl field. A similar but less drastic effect is evident for the 3rd harmonic. While there are other effects these 3 examples should suffice to illustrate that the large signal response is quite different from that of the small signal T/S parameter modeling.

The large signal effects can be summarized as an increase and spectral widening in the 2nd harmonic distortion and to a smaller extent of 3rd harmonic distortion, signal compression with signal level and unstable vibration states and jumping effects. The cumulative effects in the large signal regime would seem to account for the large increase of distortion for low frequencies in dynamic drivers. It is an interesting observation that the push-push driver mounting seems to reduce these effects. For example the THD for the TLB is ~ 1% at 60Hz where as for a comparable vented driver, 4% would be considered a good figure.

For TL design the principal effect seems to be in the modification of the phase response whereby the assumption of the minimal phase pistonic model does not hold.


[ Back to the Transmission Line Speaker Page | The TLB | Appendix TOC ]