|
The aerodynamic drag
due to sound waves in a fiber mass where the fiber diameter is small, typically about
0.01 mm, is given by:

The left-hand side
of equation is mass * acceleration and the right-hand is the aerodynamic drag.
The relationship between the drag parameter l and packing density P
is based on the theory of the flow past small cylinders and spheres and is expressed
as:
 |
Equation 1 |
There is some uncertainty
in the definition of the constants A and n, but as tentative expression,
it will be assumed that the drag parameter is given by:
 |
Equation 2 |
m is the coefficient
of viscosity of air, m = 1.81x10^-5kg/(m sec) at normal room temperature,
d = is the fiber diameter, and P is the packing density of the fiber
material, and rf is the density of the fiber material.
Therefore P/rf is the proportion of the volume taken
up by the fibers.
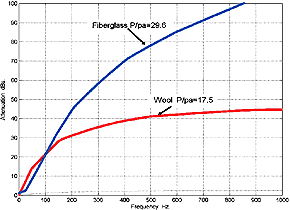
As an example of fiber parameters, the following table shows the variation between
Fiberglass and Long–Hair Wool, two of the principal fibers used in the TL line.
|
Table 1: Fiber Type Characterization
|
| |
Fiberglass
|
Long-Hair
Wool
|
|
| Packing density, P |
21 kg/m3
|
35 kg/m3
|
| Measured fiber diameter,
d |
 |
0.005
mm
|
|
 |
0.028
mm
|
|
| Estimated flow resistance,
l |
12 600
N sec/m4
|
5700
N sec/m4
|
|
|
By specifying d
and P quantities that characterize a specific fiber type, l the flow
resistance can be calculated. With the flow resistance l defined, the fiber's
attenuation and change of air velocity can be estimated. When the D c limit
is known, the causes for the TL's non-linearity for lengths > 2 meters can be
understood. This implies that by manipulating these two parameters a new type of
fiber for stuffing density can be proposed and it's effectiveness studied, ie Miraflex
or AcoustaStuff.
|
|
The
attenuation and change of velocity in a fiber mass is described by the following
equation:
 |
Equation 3 |
where a is related
to the velocity component and b the attenuation component.
The behavior of Equation
3 for low and high frequencies can be deduced as, at low frequency
|
when
,
|
wP/l --> 0 |
|
we have
|
 |
|
and
|
b --> 0 |
In other words, the
speed of sound is reduced to

and there is no attenuation
of the wave. This is consistent with the observed data for attenuation but leaves
the change in speed of sound at best a non calculated quantity in that a phase shift,
for example @ 20Hz vs @ 50Hz, is not defined. Unknown is the frequency at which the
attenuation slope begins in an unstuffed line. At high frequencies, the limiting
cases are more difficult to obtain, but it can be shown that as a
-->0 and b --> 1/2l/raw the speed of sound approaches
the ordinary adiabatic speed of sound, but the wave is attenuated at a rate of

however this is hardly
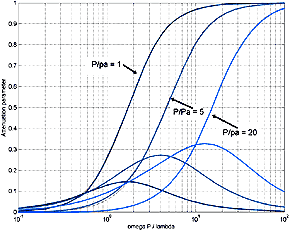
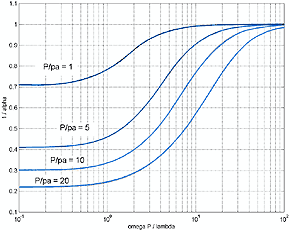
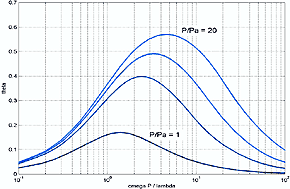
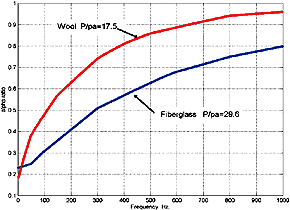
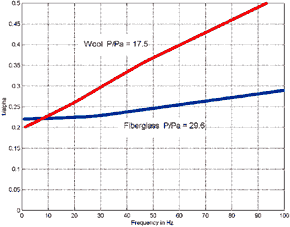
a useful quantitative definition. A quantitative view is realized by plotting the
a and b components of equation 3.
|
|
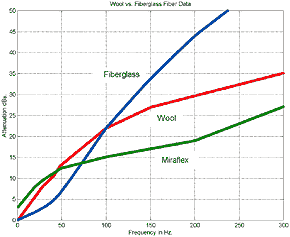
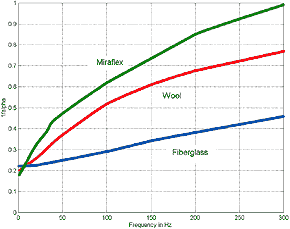
While data for Miraflex
as fundamental fiber parameters is non existent, L. de Martin (2) has
graciously provided some attenuation and change of speed data that he has taken in
his own study. Emphasizing that it is very preliminary in nature, it gives an indication
that it might be useful for TL lines in the 2-meter range.
|
|
|
|
Fig.4.3 Low Frequency Miraflex Attenuation
Data
Click Image for Larger Chart
|
Fig.4.4 Low Frequency Miraflex Change of
Air Speed Data
Click Image for Larger Chart
|
Note: that
Dacron HoloFill fiber type would lie in between the fiberglass and wool plots and
that given the relative values that can be correlated to the empirical data for stuffing
density vs. line, length of about 30% between wool and HoloFill II, then approximately
the same difference can be expected for Miraflex.
Second note: the Miraflex low frequency attenuation data was difficult to
obtain due to line resonance effects thus there is some uncertainty associated with
it. A similar problem but for the higher frequencies was present for the change in
sound velocity in the stuffed line where the msec delay accuracy was also compromised
by the line reflections and resonance. However in my opinion this data is very welcome
as it extends the limits of Bradbury's fiber data which was stopped at about 50 Hz.
(2) Data is extracted from L.de Martin Miraflex 6/13/98 termination study
(C). Since it was necessary to reformat the data to conform the data to Bradury's
fiber plot format, any errors are completely my responsibility
|


